Kitco’s live silver price feed has become a barometer not only for metals traders but also for a broader class of investors who react to its minute‑by‑minute swings. Understanding why the chart moves the way it does requires looking beyond supply‑demand fundamentals and into the collective mindset that amplifies every bump. By unpacking the behavioral triggers that drive Kitco’s numbers, readers can sidestep knee‑jerk reactions and make more disciplined decisions.
Why Market Sentiment Matters More Than the Spot Numbers
Silver’s price is subject to the same psychological currents that move equities, currencies, and even real‑estate. When Kitco publishes a sudden rise, the headline alone can stir optimism, prompting retail traders to buy on sight. Conversely, a sharp dip can ignite fear of a “silver crash,” causing a cascade of sell orders that reinforce the move. The platform’s reputation for speed makes it a feedback loop: traders watch the feed, trade on it, and in turn shape the feed.
Key Psychological Drivers Behind the Fluctuations
1. Herd Instinct
When a price spike appears on Kitco, social media platforms and trading forums amplify the signal. The fear of missing out (FOMO) compels new participants to “jump on the bandwagon,” inflating the price beyond what underlying industrial demand justifies.
2. Anchoring to Historical Peaks
Investors often reference past highs—such as the 2011 surge to $48 per ounce—as a mental anchor. Any price approaching that level is interpreted as a “return to normal,” even if macro conditions differ, nudging traders toward premature re‑entries.
3. Confirmation Bias in Technical Charts
Kitco’s live chart supplies endless candlestick patterns. Traders predisposed to technical analysis will cherry‑pick formations that confirm their existing outlook, reinforcing buying or selling pressure regardless of broader market cues.
How Kitco’s Presentation Shapes Perception
The layout of Kitco’s interface—bright red numbers for declines, green for gains, and a constantly updating ticker—acts like a visual cue that triggers emotional responses. A sudden red flash can cause panic selling, while a green surge may be misread as a sustained rally. Moreover, the prominence of “Live Price” versus “Historical Chart” subtly nudges readers toward short‑term thinking.

Practical Decision Guide for the Trend‑Aware Reader
- Step back before you act. Pause at least five minutes after a sharp Kitco move to assess whether the change aligns with macro data (e.g., industrial demand, monetary policy).
- Cross‑check with multiple sources. Verify Kitco’s price against other reputable feeds (e.g., Bloomberg, CME) to filter out platform‑specific noise.
- Use a volatility filter. Set alerts for price changes that exceed a predefined percentage, reducing the impulse to chase every tick.
- Integrate fundamental triggers. Pair sentiment analysis with concrete events—such as central‑bank purchases or mining output reports—to anchor decisions.
Implications for Investors and Traders
Recognizing the psychological scaffolding behind Kitco’s silver price fluctuations equips investors with a buffer against emotional overreactions. By treating the live feed as one data point rather than a definitive signal, market participants can align their strategies with longer‑term fundamentals. In practice, this means fewer premature entries, more stable portfolio risk, and the ability to capitalize on genuine price moves once the sentiment‑driven noise settles.
Plaques Techtoniques France At Charles Casale Blog
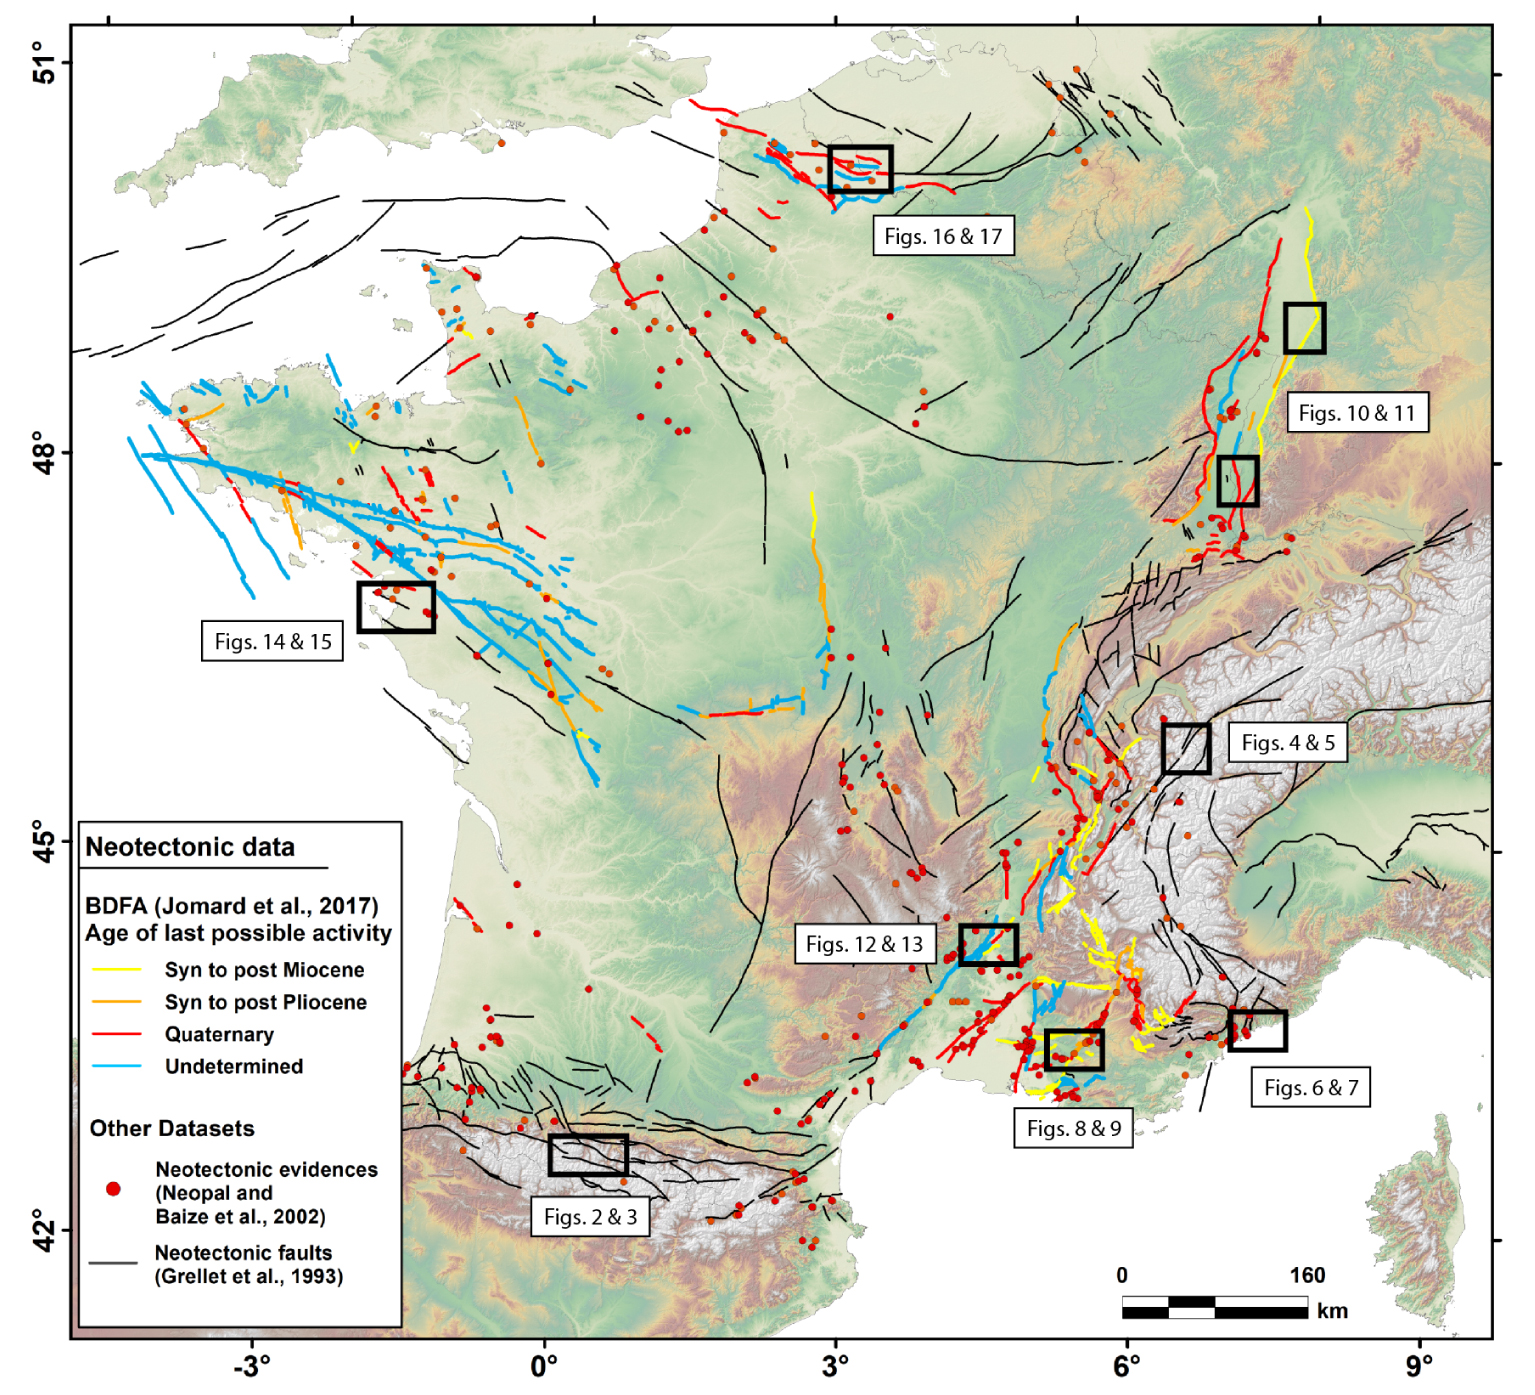
Plaques Techtoniques France at Charles Casale blog
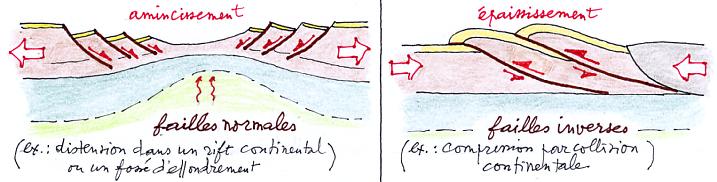
Les Déformations Tectoniques Cassantes : Les Failles

Les déformations tectoniques cassantes : les failles
Exercices | Lelivrescolaire.fr

Exercices | Lelivrescolaire.fr